REA Insights Commercial Property Snapshot, August 2021
With multiple states going into snap lockdowns, demand for commercial property proved fairly mixed in July.
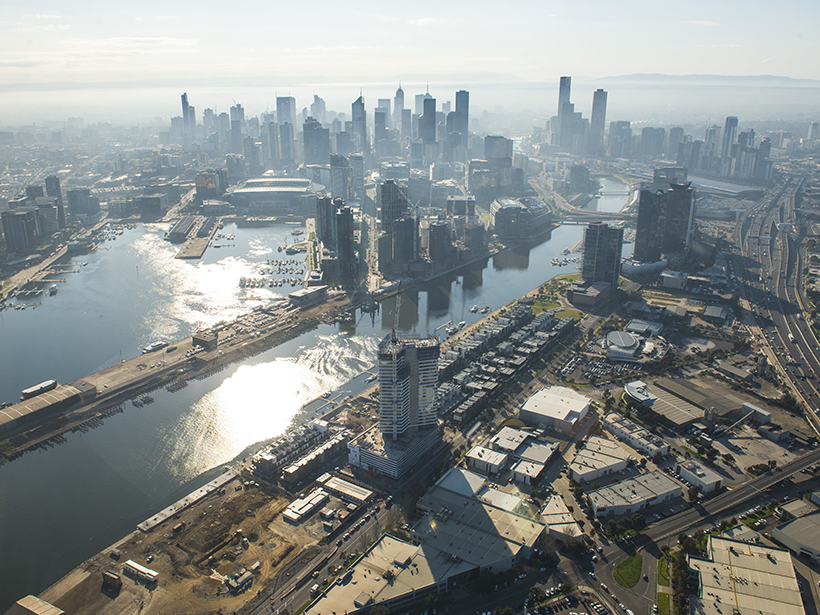
Victoria hit a record high for buyer searches on realcommercial.com.au last month, in stark contrast to a locked-down New South Wales and South Australia, which recorded falls across both ‘Buy’ and ‘Lease’.
In this month’s commercial snapshot, we continue to track search volumes over time and demand by category. We also provide a view of user behaviour by analysing the most-searched keywords per asset class, as well as looking at the most popular commercial property listings for the month.
How are search volumes tracking?
National ‘Buy’ search volumes increased by 3.1% in July 2021 compared to the month prior, with all states/territories bar two showing month-on-month growth.
This growth can be attributed to record-breaking search volumes for multiple states including Victoria, Western Australia, Tasmania, Northern Territory and the Australian Capital Territory. Demand for commercial property in these states/territories continued to grow, despite the emergence of restrictions in response to COVID-19’s Delta strain.
Search volumes in New South Wales have been trending downwards for the past four months. The state recorded a month-on-month decrease of 2% and is now only 14.7% higher than the same time last year.
South Australia was the other state that recorded a month-on-month decline in July, falling 1%. Given South Australia’s search volumes have been growing since the start of 2021, it’s likely the July dip was caused by state’s snap lockdown last month.
Lockdowns in New South Wales and South Australia heavily impacted the leasing sector, with national ‘Lease’ search volumes down 4% month-on-month.
‘Lease’ searches in New South Wales have been gradually decreasing since March 2021, with July bringing about a substantial 14.1% month-on-month decrease. South Australia recorded a 9.4% decrease last month.
In July, the medical/consulting category recorded the largest year-on-year growth, at 74%. The category with the smallest growth was hotel/leisure, which saw 21% growth. Since March 2021, the number of searches for medical/consulting listings has exceeded that of the hotel/leisure category on average by 19%.
What are people and businesses looking to buy?
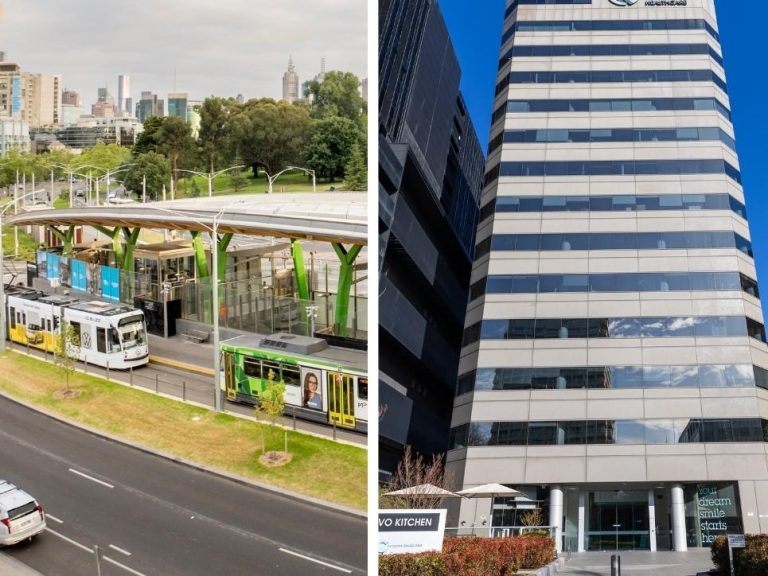
As with its ongoing increase in buyer searches, views per listing for the medical/consulting category showed both a strong year-on-year (77%) and month-on-month (6%) growth in July.
The Australian Capital Territory drove much of this year-on-year result, recording a significant 234% increase in views per listing as demand continues to outstrip supply.
The hotel/leisure category the largest month-on-month increase in July (15%), which can be attributed to the sizeable growth in Queensland (24%), Victoria (23%) and New South Wales (10%).
What are people and businesses looking to lease?
In the lease sector, warehouses saw the largest year-on-year growth in views per listing (56%). This was driven by substantial increases across all states with Western Australia (82%) and Tasmania (72%) recording the largest year-on-year growth.
Growth in views per listing for the hotel/leisure category remained low relative to the other categories, up 9% year-on-year. The category also saw the largest month-on-month decline in July (8%).
New South Wales recorded a small year-on-year increase of 3%, despite the state’s lockdown.
What are the features that people and businesses are looking for?
In this month’s analysis of most searched keywords, we see a growing demand for retail listings with an associated dwelling, with keywords such as ‘residential’, ‘dwelling’ and ‘residence’ climbing up the ranks.
What have been the most popular commercial listings?
See the top 10 most viewed commercial listings nationally and in each state below.
The most-viewed listing this month was a old corner shop with an enviable location in central Melbourne. The property was built in the 1800s.