The rental trap at the top: Big earners renting around the nation

The suburb with by far the highest share of high-income residents is Duntroon in Canberra – no prizes for guessing why.
We are finally reading more about rental affordability, built-to-rent developments are getting taxed favourably, and the state and federal governments are trying to make renting more affordable.
These are great general developments. Today we are looking at the other end of the rental game and look for high-income renters.
At the 2021 census, 12.2 million households called Australia home. If your household income exceeded the highest recorded income bracket of $416,000, you belong to the top 1.2 per cent. A total of 151,000 households fell into that category. It’s not surprising that only 9 per cent of them rented their home. The national average of households that rents was 32 per cent.
Instead of just looking at the top 1 per cent of households, we will be exploring a broader definition of high-income households. About 22 per cent of households (2.7 million) take home more than $182,000 and can be classified as high-income. While many of these households wouldn’t think of themselves as high-income, it’s fair to classify the top 22 per cent in that way. Only 16 per cent (424,000) of these high-income households are renting.
Landlords tend to consider high-come renters as dream tenants who are unlikely to ever miss a payment. Having high-income earners in a tight rental market can’t possibly be good news for lower-income renters.
Let’s have a closer look and let’s nickname our subjects HIRs (high-income renters) since we will refer to them a lot in the coming paragraphs.
HIRs were twice as likely to have lived overseas a year before the 2021 census than low-income renters. HIRs were also more likely to have moved house in the previous year. This suggests a relatively mobile cohort that is just testing out a new location before committing to buying. Think overseas doctors in a regional destination, freshly arrived knowledge workers on temporary visas in the inner suburbs of Sydney.
Australian citizens, regardless of income, are much more likely to live in a household that owns their property (72 per cent) than non-citizens (43 per cent). Most non-citizen residents will want to become citizens eventually.
Citizenship makes the path to home ownership bureaucratically easier, and you might be eligible for more government subsidies.
Since there are so many hurdles to transfer big chunks of money across borders, migrants are less likely to tap into the bank of mum and dad. On average, they therefore need longer to save up enough money for a down payment, even if they live in high-income households.
The industry of employment also matters are great deal. HIRs are much more likely to work in professional services (14 per cent), health (14 per cent), or education (8 per cent) compared to the rest of the population.
These three industries all tend to be clustered in the inner suburbs of our largest cities.
Let’s draw a few concentric circles around the central business districts of our largest cities and see where the HIRs are hiding.

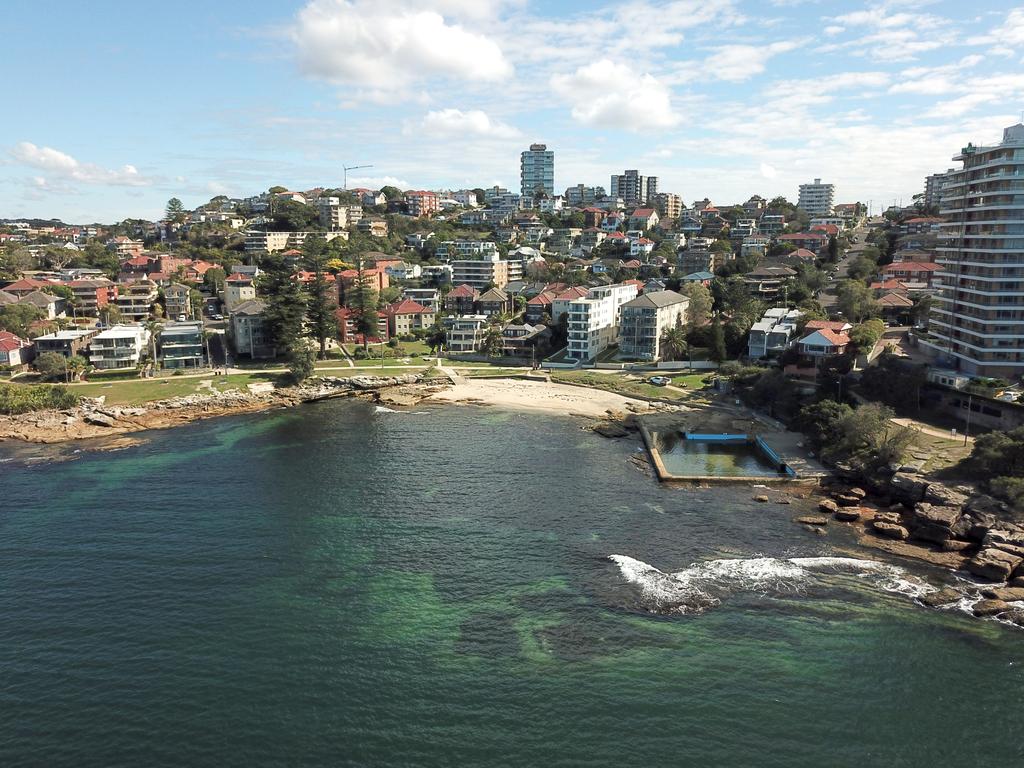
Fairlight Beach and rock pool near the Sydney CBD. Picture: Manly Daily
In the inner 5km radius, HIRs make up 12 per cent of all renters, and 6 per cent of all households. The further we travel from the CBD, the fewer HIRs we find. In the outer suburbs (15 to 25km from the CBD), HIRs make up only 6 per cent of all renters, and 2 per cent of all households.
High-income defence personnel are also about two times more likely to be renting than the average Australian. Mining workers too are more likely to be renting despite earning high incomes. The transitory and flexible nature of these industries makes renting often the more suitable housing choice.
Having read a few paragraphs about who HIRs are, you won’t be surprised about the five cities with the largest share of HIRs: Karratha (27 per cent of renters are HIRs), Port Hedland (22 per cent), Kalgoorlie (12 per cent), Sydney (11 per cent), and Mount Isa (11 per cent).
Functional towns servicing mining and defence industries have a large cohort of highly-paid workers. Many of these workers don’t plan to stay there forever and rent by choice.
Sounds great, doesn’t it? Where is the problem?
Housing in these towns is hard to come by, markets adjust, and homes are far from affordable.
In Karratha, a very modest three-bedroom dwelling costs more than $35,000 a year to rent.
A nice-looking family home easily exceeds $100,000.
A $300,000 household renting for more than $100,000 is technically in rental stress. Money just melts away since life in Karratha and co is hardly cheap.
Seeing Sydney at the top of the HIRs list makes sense too. A famously expensive property market continues to make life less attractive even for high-income earners. Five of the 11 suburbs where HIRs make up the highest share of all households are in Sydney: North Sydney (15 per cent), Manly-Fairlight (14 per cent), St Leonards-Naremburn (13 per cent), Crows Nest-Waverton (13 per cent), and Coogee-Clovelly (13 per cent).
The suburb with by far the highest share of HIRs (35 per cent) is Duntroon in Canberra. I’m sure you can guess why.
Duntroon is dominated by the Royal Military College. High-income earning personnel who aren’t planning to make the suburb their forever home are located here.
At least life isn’t as expensive in Canberra as it is in Karratha.
High-income-renters describe households that are taking home a decent pile of money, but due to location and price pressures, they are forced to spend a huge share of that wealth on housing without building up wealth.
At the beginning of the column, I claimed that HIRs wouldn’t consider themselves to be high-income earners – now we know why.
Simon Kuestenmacher is co-founder and director of research at The Demographics Group.


